Code
import networkx as nx # import NetworkX first!
G = nx.Graph()
G.add_node(1)
G.add_node(2)
G.add_edge(1,2)
#or
G.add_nodes_from([3,4,5])
G.add_edges_from([(3,4),(3,5)])
G.nodes()
G.edges()
list(G.neighbors(3))
[4, 5]Can we represent any problem as a network problem?
net.work: an interconnected or interrelated chain, group, or system
A network Net (or graph G, we will use interchangebly) is comprised of a set of nodes N(or vertices V, we will use interchangebly) and a set of arcs A (or edges E, we will use interchangebly).
N = (V,E) or G = (N,A)
Two nodes are adjacent to each other if there is an edge between them. One is the neighbor of the other.
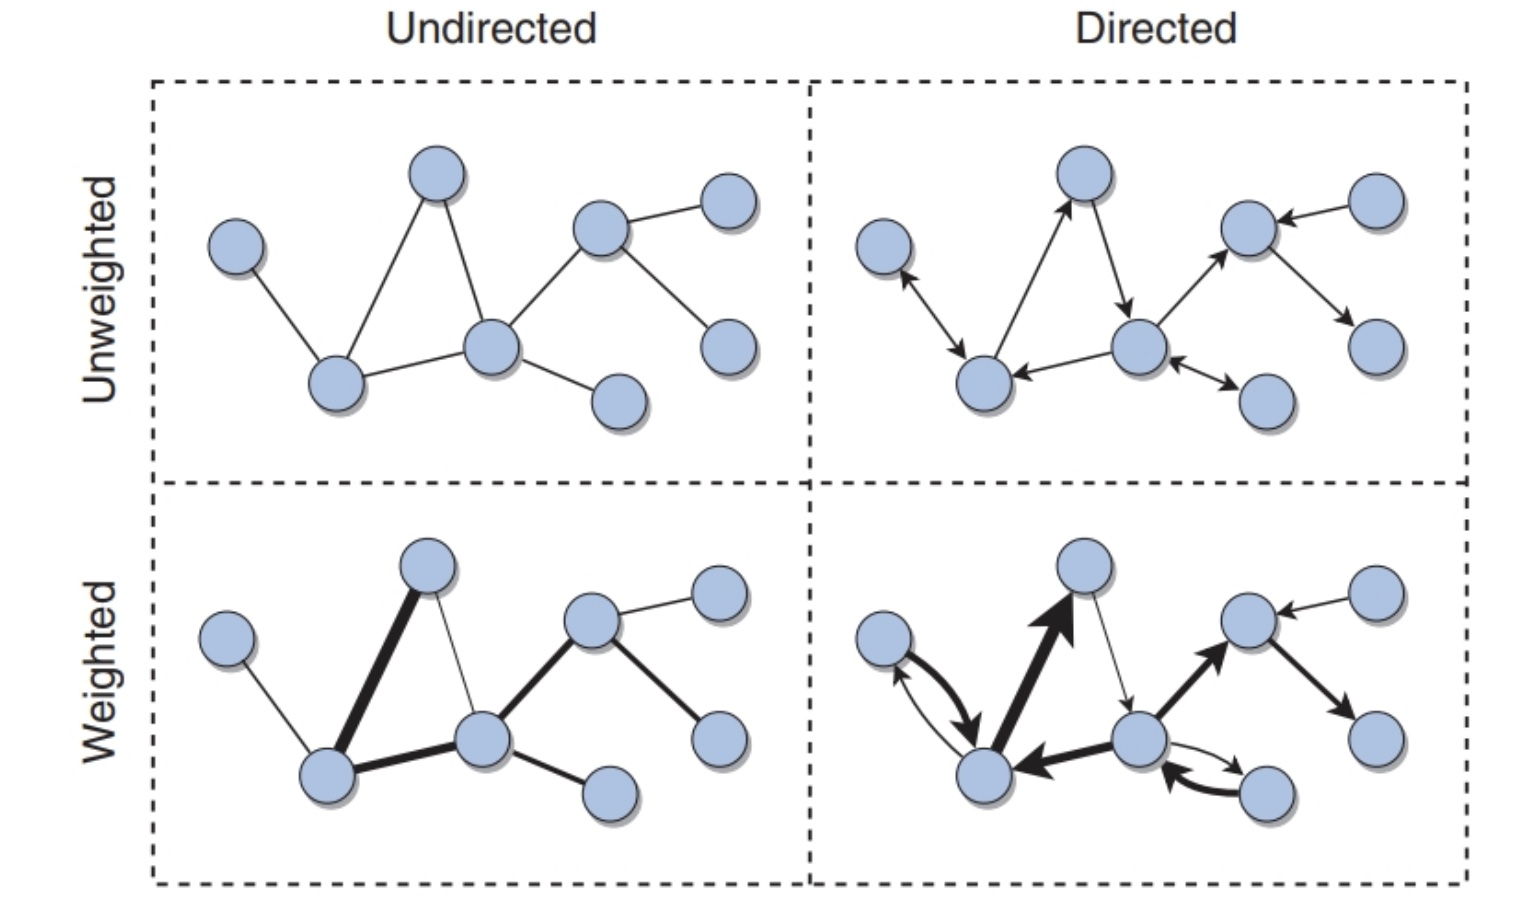
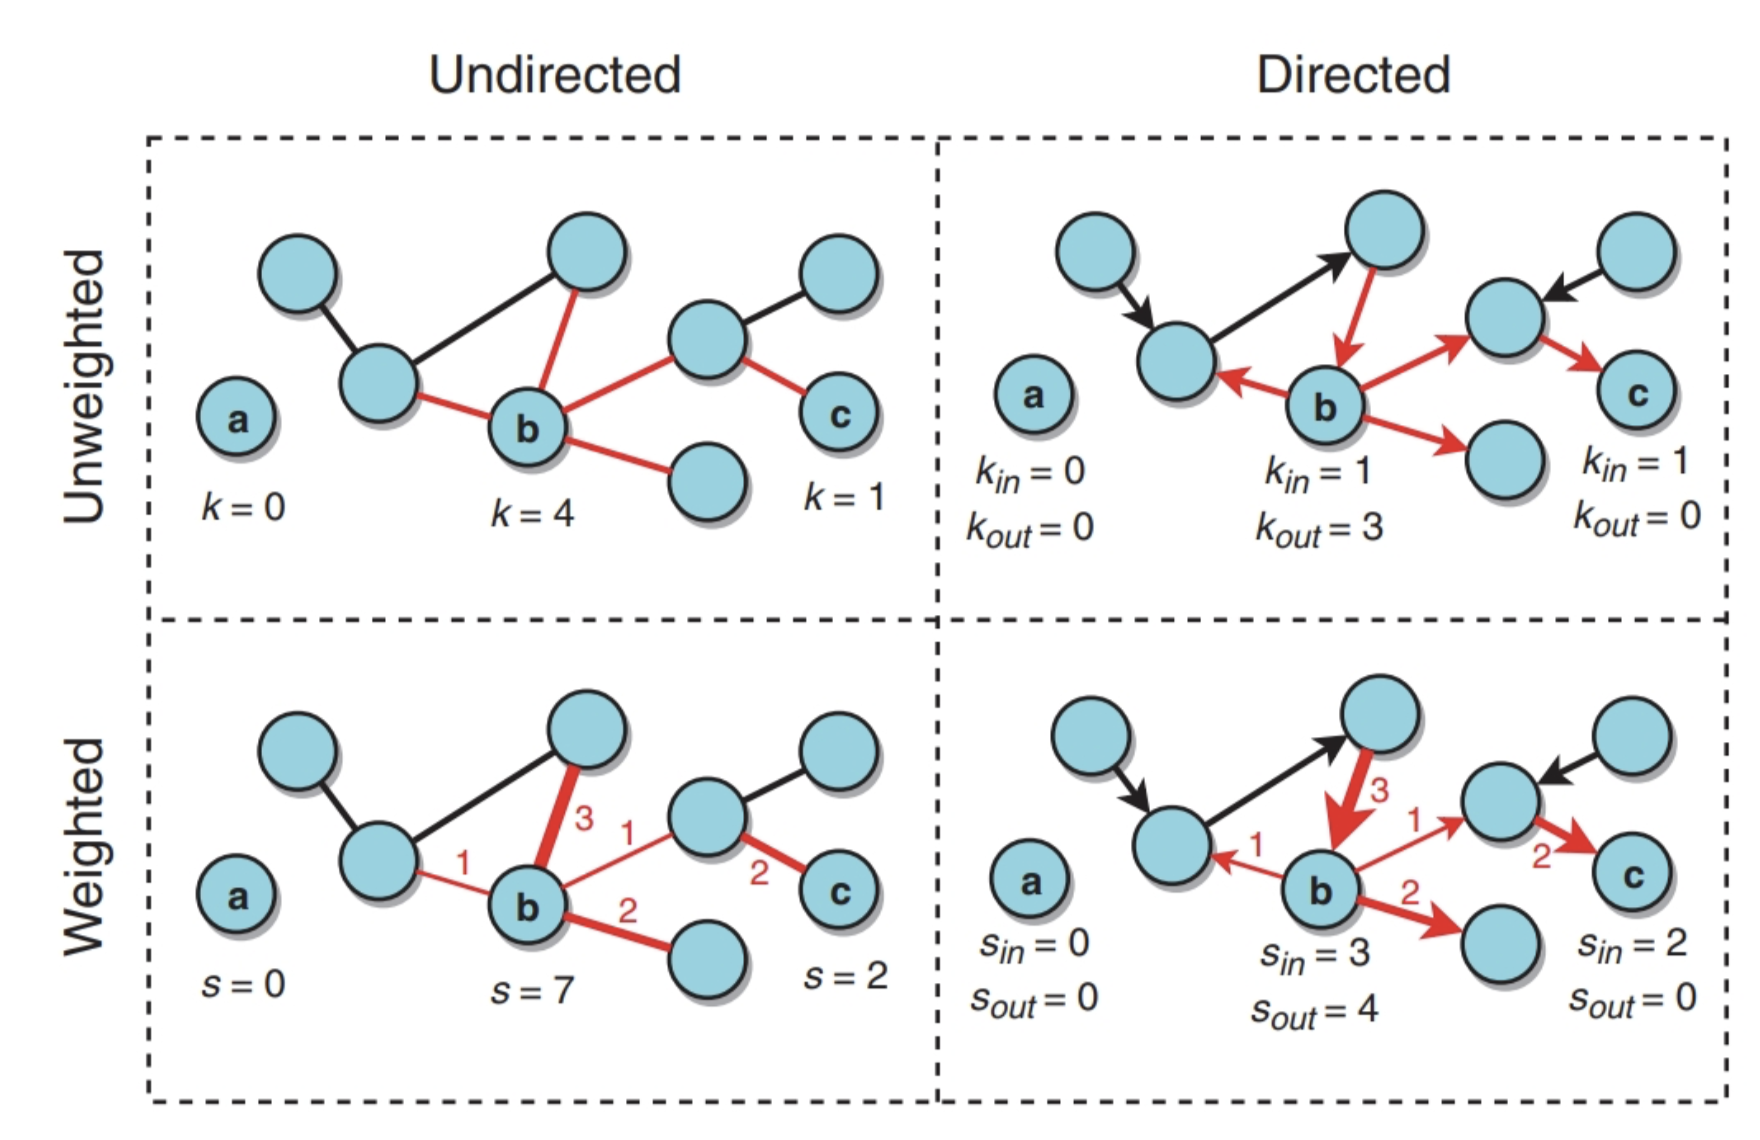
Graphs can be weighted and directed (see Figure 1)
import networkx as nx # import NetworkX first!
G = nx.Graph()
G.add_node(1)
G.add_node(2)
G.add_edge(1,2)
#or
G.add_nodes_from([3,4,5])
G.add_edges_from([(3,4),(3,5)])
G.nodes()
G.edges()
list(G.neighbors(3))[4, 5]Print nodes or edges (you expected the word arc after node, no worries :))
for n in G.nodes:
    print(n, list(G.neighbors(n)))
for u,v in G.edges:
    print(u, v)
1 [2]
2 [1]
3 [4, 5]
4 [3]
5 [3]
1 2
3 4
3 5Access some of the attributes of the graph
import networkx as nx

# Create a sample graph
G = nx.Graph()
G.add_edge(1, 2, weight=5)
G.add_edge(2, 3, weight=2)
G.add_node(1, label='A')
G.add_node(2, label='B')
G.graph['name'] = 'My Graph'

num_nodes = G.number_of_nodes()
num_edges = G.number_of_edges()
print("Number of Nodes:", num_nodes)
print("Number of Edges:", num_edges)


# Print edge attributes
print("Edge attributes:")
for u, v, attributes in G.edges(data=True):
    print(f"Edge ({u}, {v}): {attributes}")

# Print node attributes
print("\nNode attributes:")
for node, attributes in G.nodes(data=True):
    print(f"Node {node}: {attributes}")

# Print graph attributes
print("\nGraph attributes:")
print(G.graph)
Number of Nodes: 3
Number of Edges: 2
Edge attributes:
Edge (1, 2): {'weight': 5}
Edge (2, 3): {'weight': 2}
Node attributes:
Node 1: {'label': 'A'}
Node 2: {'label': 'B'}
Node 3: {}
Graph attributes:
{'name': 'My Graph'}Let’s see how this graph looks like
nx.draw_networkx(G)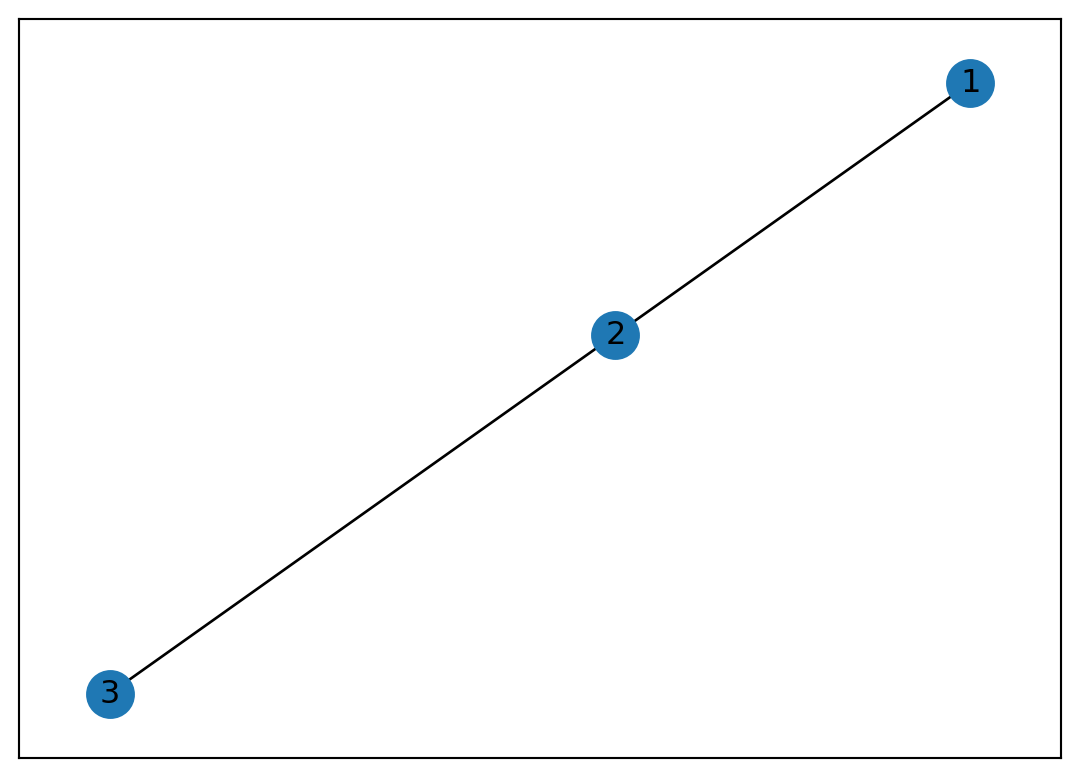
Directed graph construction:
D = nx.DiGraph()
D.add_edge(1,2)
D.add_edge(2,1)
D.add_edges_from([(2,3),(3,4)])
D.number_of_nodes()
D.number_of_edges()4How do neigbors change?
list(D.neighbors(2))
list(D.predecessors(2))
list(D.successors(2))
[1, 3]There are some template networks to generate
#%matplotlib inline
import networkx as nx
import matplotlib.pyplot as plt
B = nx.complete_bipartite_graph(4,5)
C = nx.cycle_graph(4)
P = nx.path_graph(5)
S = nx.star_graph(6)
# Plot the graph
nx.draw_networkx(S)
# Show the graph
plt.show()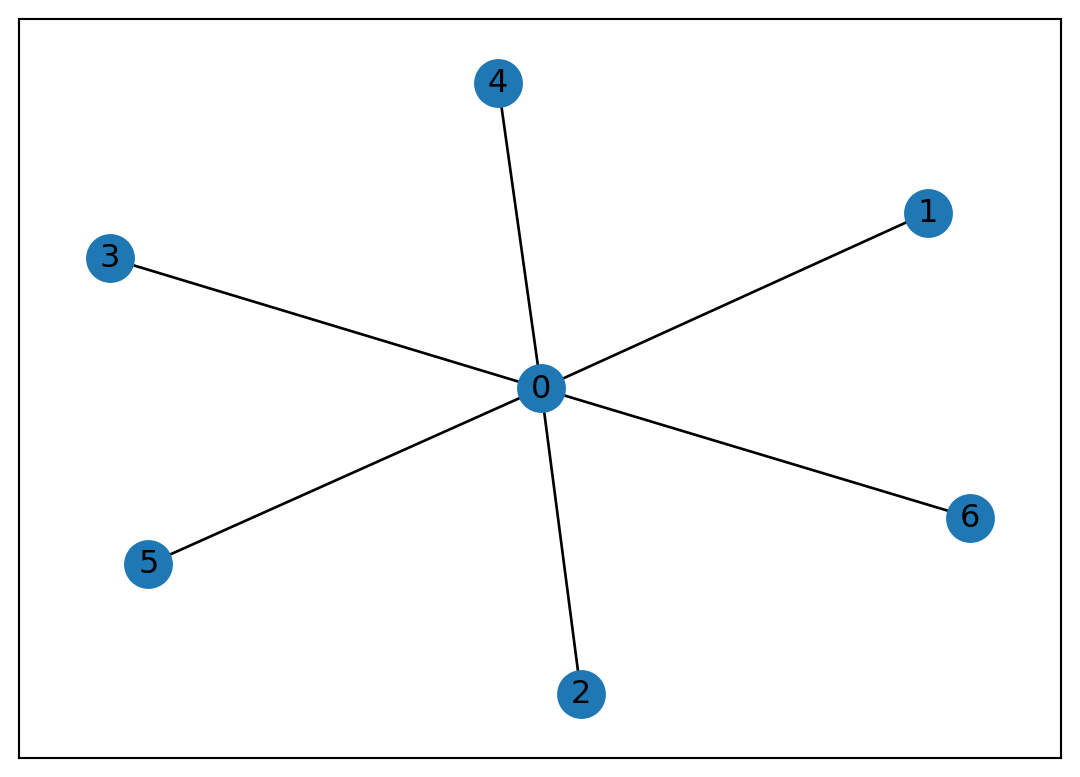
A little digression here, in case some of you wants to use numpy arrays to generate networks! Adjacency matrix is a very common way of network representation [].
import numpy as np
adjacency_matrix = np.array([[0, 1, 1, 0], [1, 0, 0, 1], [1, 0, 0, 0], [1, 1, 0, 0]])
print(adjacency_matrix)
G = nx.Graph(adjacency_matrix, nodetype=int)
nx.draw_networkx(G)
[[0 1 1 0]
[1 0 0 1]
[1 0 0 0]
[1 1 0 0]]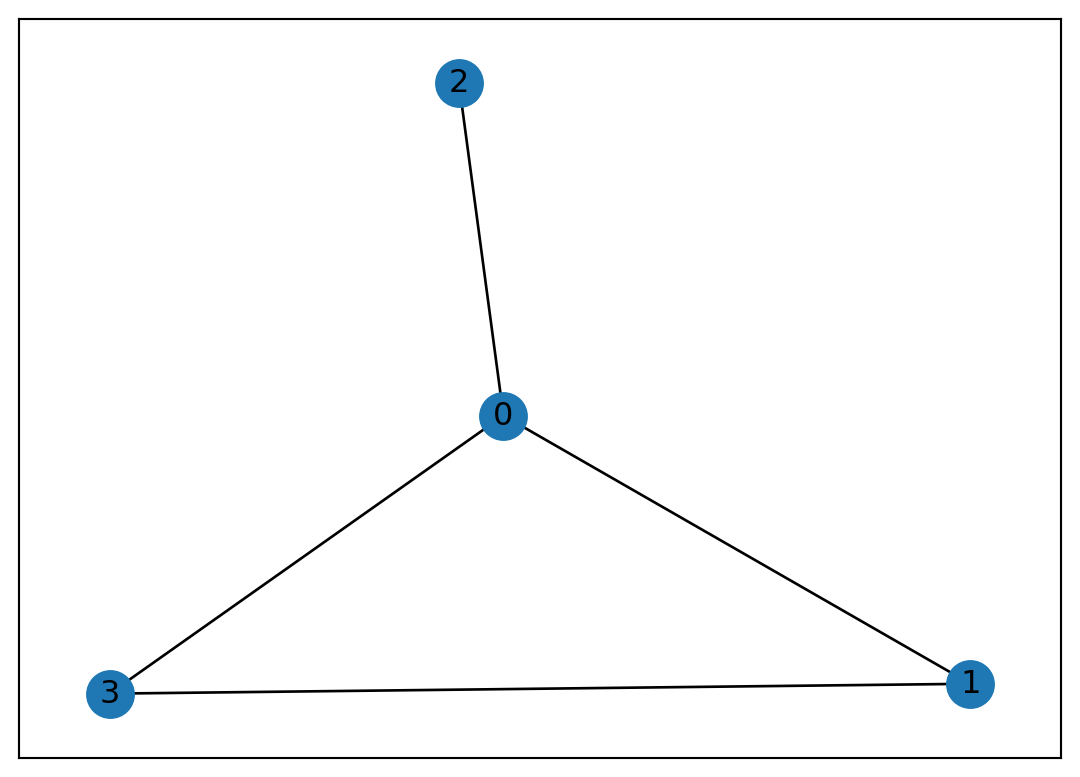
Directed counterpart:
import numpy as np
adjacency_matrix = np.array([[0, 1, 1, 0], [1, 0, 0, 1], [1, 0, 0, 0], [1, 1, 0, 0]])
print(adjacency_matrix)
G = nx.DiGraph(adjacency_matrix, nodetype=int)
nx.draw_networkx(G)
[[0 1 1 0]
[1 0 0 1]
[1 0 0 0]
[1 1 0 0]]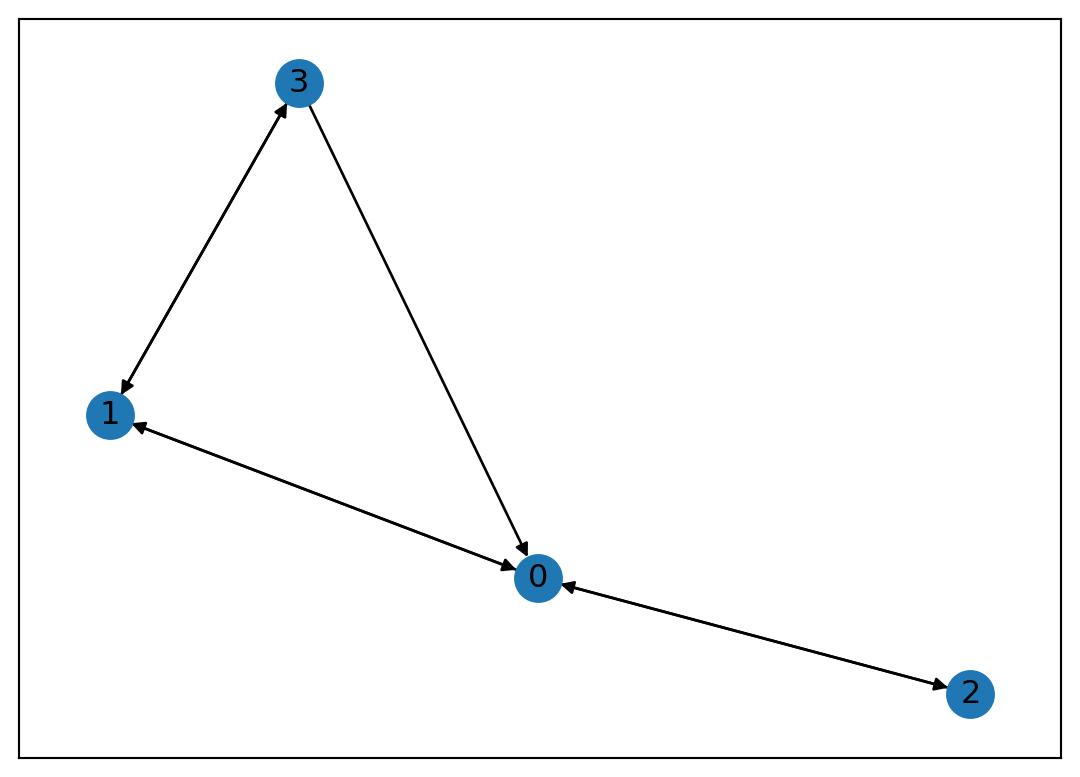
Another way to represent networks is using an adjacency list.
def generate_adjacency_list(edges):
    adjacency_list = {}

    for u, v in edges:
        if u not in adjacency_list:
            adjacency_list[u] = []
        if v not in adjacency_list:
            adjacency_list[v] = []

        adjacency_list[u].append(v)
        adjacency_list[v].append(u)

    return adjacency_list

# Example edges
edges = [(1, 2), (1, 3), (2, 3), (3, 4), (4, 5)]

# Generate the adjacency list
adj_list = generate_adjacency_list(edges)
print(adj_list)
{1: [2, 3], 2: [1, 3], 3: [1, 2, 4], 4: [3, 5], 5: [4]}# Print the adjacency list
for node, neighbors in adj_list.items():
print(f"Node {node}: {neighbors}")
# generate graph from the adj list
G1 = nx.Graph(adj_list, nodetype=int)
nx.draw_networkx(G1)Node 1: [2, 3]
Node 2: [1, 3]
Node 3: [1, 2, 4]
Node 4: [3, 5]
Node 5: [4]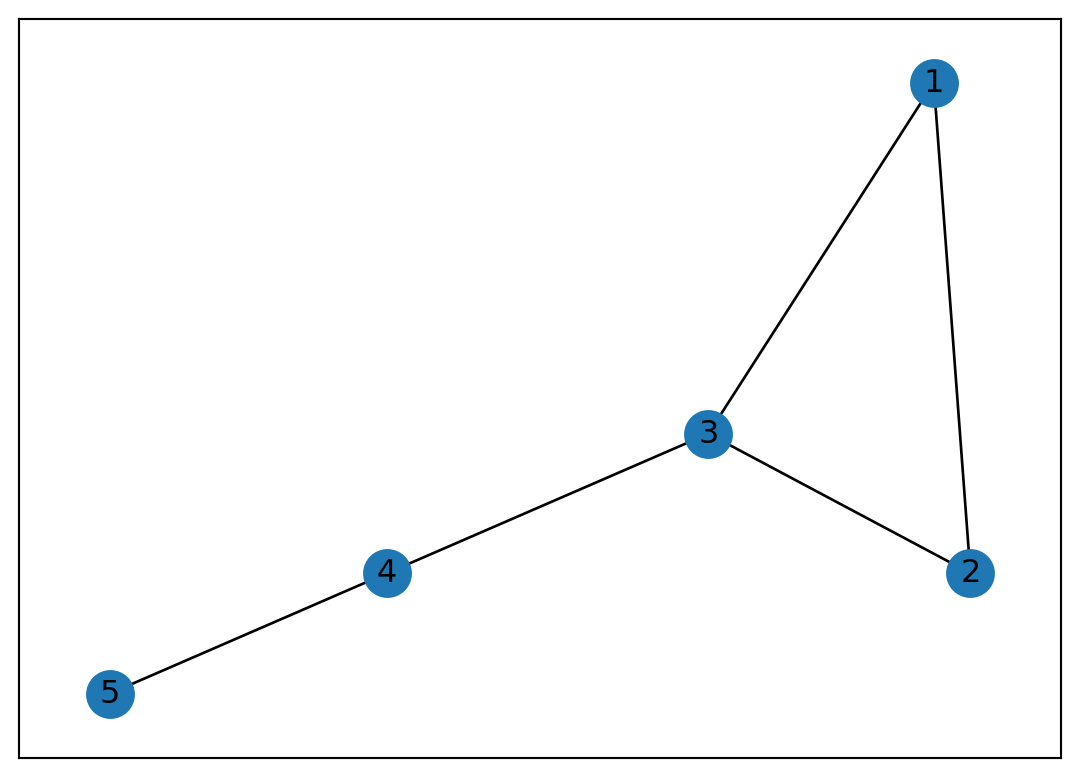
G2 =nx.read_adjlist('adj_list.txt', nodetype=int)
G2.edges()
nx.draw_networkx(G2) 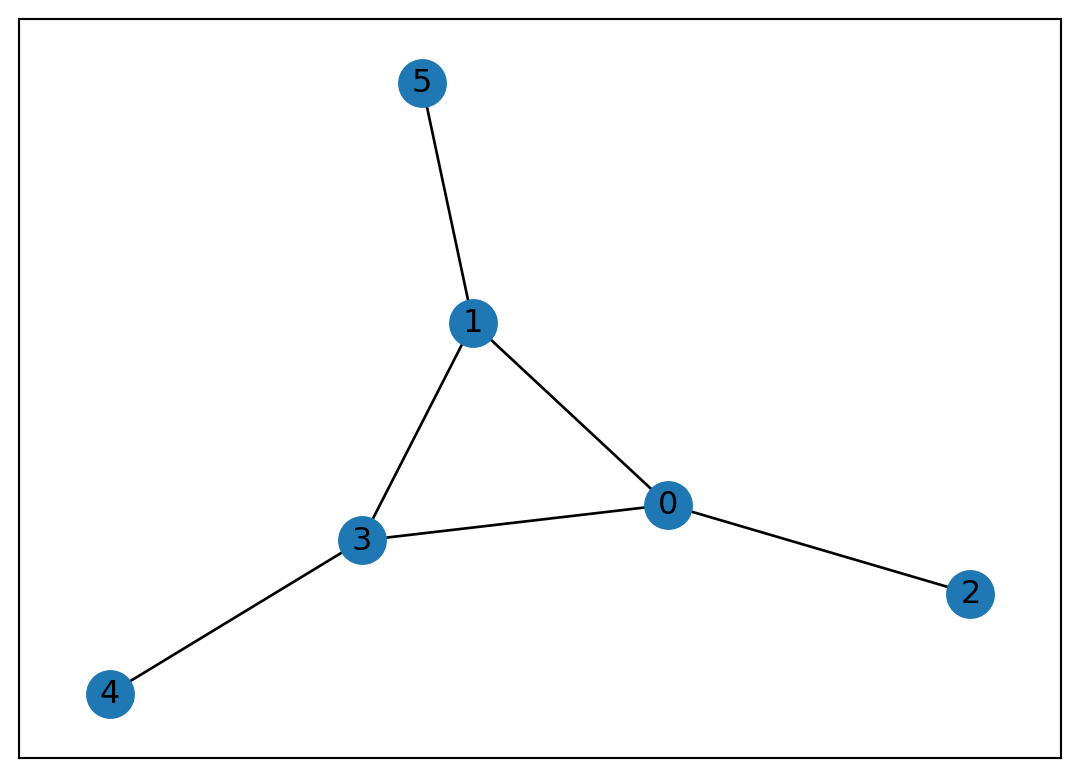
Or we can simply generate a graph from a list of edges called edge list:
import matplotlib.pylab as plt
EL = [(0,1), (0,2), (1,3)]
G3 =nx.Graph(EL, nodetype=int)
G3.edges()
plt.axis('off')
nx.draw_networkx(G3) 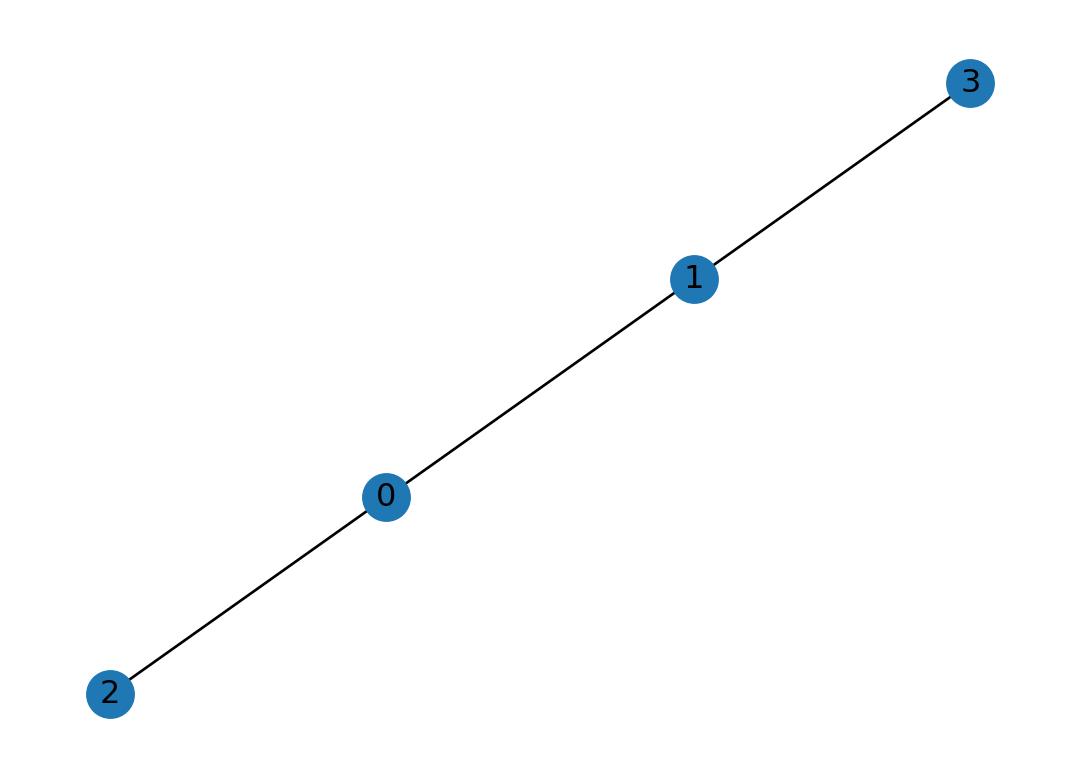
One goodness with edge lists is that we can add more features of the graph such as weights of edges. pandas dataframe is also powerful to add more features to the graph.
import pandas as pd
df = pd.DataFrame({'from': [1,2,2,3],
'to': [2,3,4,4],
'color': ['blue','green','blue','orange'],
'weight': [1,2,3,4]})
df| from | to | color | weight | |
|---|---|---|---|---|
| 0 | 1 | 2 | blue | 1 |
| 1 | 2 | 3 | green | 2 |
| 2 | 2 | 4 | blue | 3 |
| 3 | 3 | 4 | orange | 4 |
G = nx.from_pandas_edgelist(df, 'from', 'to', edge_attr=['color'] )
G.edges(data=True)
EdgeDataView([(1, 2, {'color': 'blue'}), (2, 3, {'color': 'green'}), (2, 4, {'color': 'blue'}), (3, 4, {'color': 'orange'})])Visualization example:
G = nx.MultiGraph()
G.add_nodes_from([('A', {'pop':1000, 'lifeq':'+'}), ('B', {'pop':5000, 'lifeq':'o'}),\
                  ('C', {'pop': 7500, 'lifeq':'+'}), ('D', {'pop': 3200, 'lifeq':'-'}),\
                 ('E', {'pop': 8500, 'lifeq':'o'}), ('F', {'pop':2100, 'lifeq':'-'})])

G.add_edges_from([ ('A', 'D', {'speed':'fast'}),
                   ('E', 'D', {'speed':'fast'}),
                   ('F', 'C', {'speed':'slow'}),
                  ('E', 'C', {'speed':'slow'}),
                 ('B', 'D', {'speed':'medium'}),
                 ('E', 'B', {'speed':'medium'}),
                 ('A', 'F', {'speed':'fast'})])

names = {'A': 'Appleville', 'B':'Boomtown', 'C':'Carrot-City', 'D':'Darktown', 'E':'Elephant-Gardens', 'F':'Fluxhole'}

# node size
population = [nx.get_node_attributes(G, 'pop')[node]/10. for node in G]

# node color
color_of_quality = {'+': 'green', '-':'red', 'o':'grey'}
quality_colors = [color_of_quality[nx.get_node_attributes(G, 'lifeq')[node]] for node in G]

# edge color
color_of_transport={'slow':'black', 'medium':'navy', 'fast':'gold'}
transport_colors = [color_of_transport[prop['speed']] for u, v, prop in G.edges(data=True)]


nx.draw_circular(G, \
                 node_size=population, \
                 node_color=quality_colors, \
                 edge_color=transport_colors, \
                 width=2, \
                 with_labels=True, \
                 labels=names)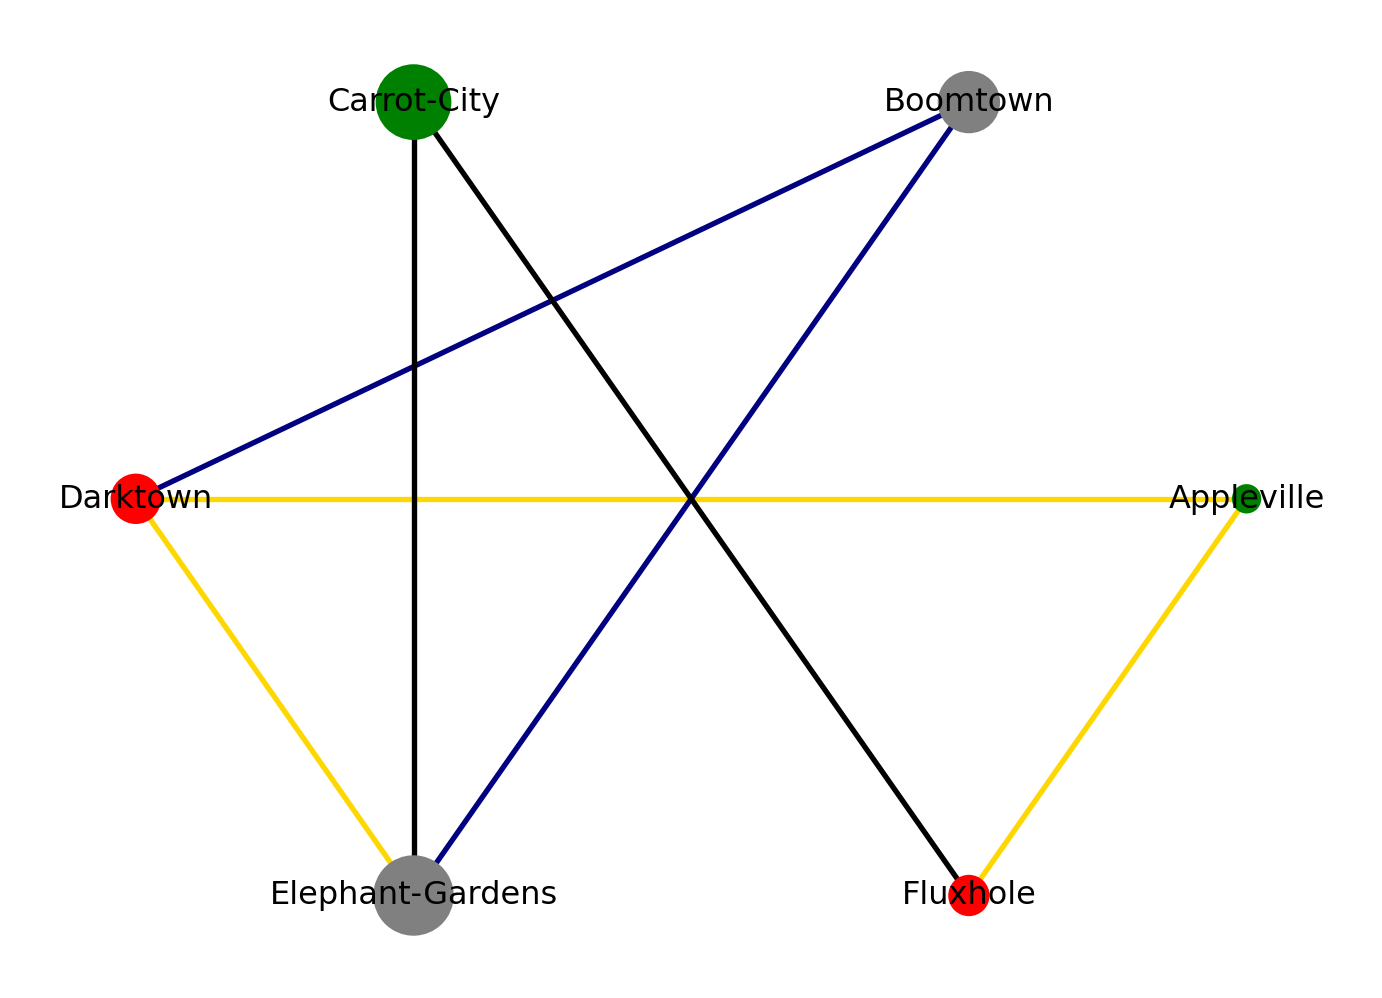
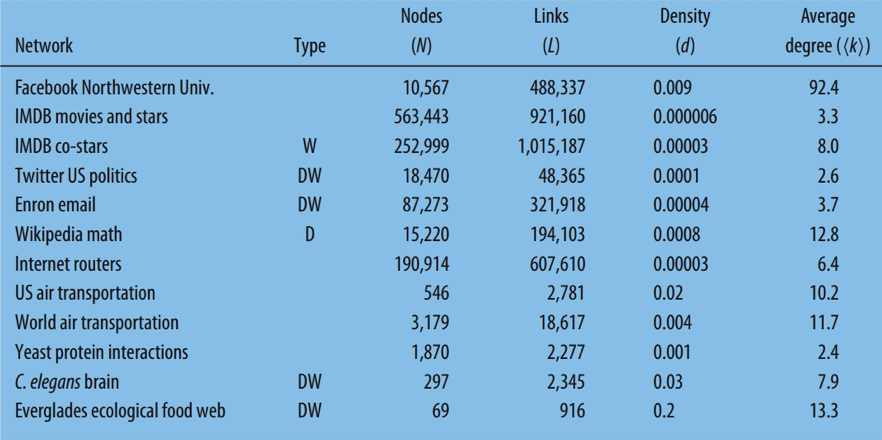
An undirected network is sparse if:
\[L \ll L_{max} = \frac{N(N-1)}{2}\]
where \(L\) is the number of links and \(N\) is the number of nodes. or if \(L\) grows proportionally to \(N\). Density of a network is found by:
\[d = \frac{L}{L_{max}}\]
average degree of a network is found by:
\[\langle k \rangle = \frac{2L}{N}\]
How to add weighted edges to a graph:
import networkx as nx
W = nx.Graph()
W.add_edge(1,2,weight=6)
W.add_weighted_edges_from([(2,3,3),(2,4,5)])
W.edges(data=True)
for (i,j,w) in W.edges(data='weight'):
    if w>3:
        print('(%d, %d, %d)' % (i,j,w)) # skip link (2,3)
(1, 2, 6)
(2, 4, 5)Loop over the adjacency list:
print(list(W.adjacency()))
for n, neighbors in W.adjacency():
    print(neighbors.items())
    for number, link_attributes in neighbors.items():
        print('(%d, %d, %d)' % (n, number, link_attributes['weight']))
[(1, {2: {'weight': 6}}), (2, {1: {'weight': 6}, 3: {'weight': 3}, 4: {'weight': 5}}), (3, {2: {'weight': 3}}), (4, {2: {'weight': 5}})]
dict_items([(2, {'weight': 6})])
(1, 2, 6)
dict_items([(1, {'weight': 6}), (3, {'weight': 3}), (4, {'weight': 5})])
(2, 1, 6)
(2, 3, 3)
(2, 4, 5)
dict_items([(2, {'weight': 3})])
(3, 2, 3)
dict_items([(2, {'weight': 5})])
(4, 2, 5)Calculate in degree and out degree of a node using linear algebra:
import numpy as np

A = np.array([[0, 1, 1, 0], [1, 0, 0, 1], [1, 0, 0, 0], [1, 1, 0, 0]])
i = 0
# Assuming A is your adjacency matrix
degree_of_node_i = np.sum(A[i, :])  # Sum the elements in row i (or A[:, i] for the column) undirected
out_degree_of_node_i = np.sum(A[i, :])  # Sum the elements in row i
in_degree_of_node_i = np.sum(A[:, i])  # Sum the elements in column i
print(degree_of_node_i)
print(out_degree_of_node_i)
print(in_degree_of_node_i)
2
2
3Import a network from an external link:
import networkx as nx

#import graph from an external link
#GE = nx.read_edgelist('facebook_combined.txt.gz') #reading from internal directory
#print('number of nodes:', GE.number_of_nodes())
#print('number of edges:', GE.number_of_edges())
#print('graph is:', GE.graph)
#nx.draw(GE, node_sizes)import networkx as nx
import urllib.request
import gzip
import io
# Replace 'http://snap.stanford.edu/data/facebook_combined.txt.gz' with your actual URL.
url = 'http://snap.stanford.edu/data/facebook_combined.txt.gz'
# Download the .gz file from the URL and load it into a NetworkX graph.
with urllib.request.urlopen(url) as response:
with gzip.GzipFile(fileobj=io.BytesIO(response.read())) as f:
GE = nx.read_edgelist(io.TextIOWrapper(f, 'utf-8'))
# Now, 'GE' contains your graph data.
print('Number of nodes:', GE.number_of_nodes())
print('Number of edges:', GE.number_of_edges())Number of nodes: 4039
Number of edges: 88234